
Last weekend’s article outlined a strong case for a continuation of the S&P 500 (SPY) rally and concluded “4325-34 should initially hold dips for a target of 4402, perhaps 4415.” This was pretty much what happened as the weekly low came in at 4344 and the high on Friday was 4418.
The S&P500 has now gained over 7% in two weeks. This is obviously great if you bought near 4103, but what if you finally decided to buy at 4418? Friday’s strong move looked like it was driven by FOMO (Fear Of Missing Out), perhaps as Mondays have now closed higher 17 out of the last 18 times. These are good odds, but the situation is different now that buyers are chasing the rally rather than closing out in fear each Friday.
This week’s article looks at whether the current rally is likely to continue and what to look for to signal a reversal. Most importantly, it investigates where we can buy the next dip. Various technical analysis techniques will be applied to multiple timeframes in a top-down process which also considers the major market drivers. The aim is to provide an actionable guide with directional bias, important levels, and expectations for future price action.
S&P 500 Monthly
The November bar has already broken above the October high of 4393 which neutralizes any bearish bias the monthly chart had. It now has to close above this level to shift the bias from neutral to bullish.
Only a close below 4201 (the November open) would put bears back in control.
SPX Monthly (TradingView)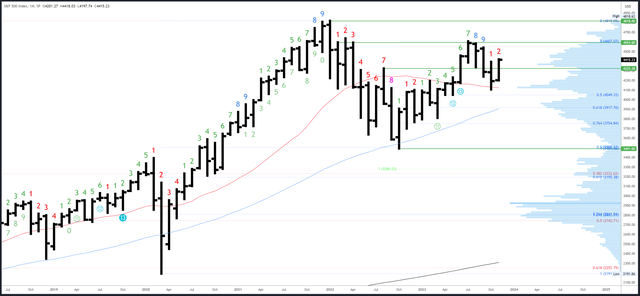
Initial monthly resistance is the October high of 4393. This held perfectly on Thursday but then broke on Friday. The lower timeframes can be used to assess whether this break can be sustained.
4593-4607 is the next resistance.
Initial support is 4103, then 4049 at the April-May double bottom in confluence with the 50% retrace. 4201 is not really a support level but is relevant to whether the November bar is leaning bullish or bearish. 4325-35 may still be relevant at some point, but has been chopped through a little too much to be a strong level.
The September bar completed a Demark upside exhaustion count. This is having a clear effect and the weakness can persist over several bars (months). November will be bar 2 (of a possible 9) in a new downside exhaustion count.
S&P 500 Weekly
A continuation bar formed this week. This was predictably smaller than the 5.8% range of the preceding bar, but was still strong as it broke above the 20-week MA and closed near the highs. This projects some follow through above 4418 next week.
SPX Weekly (TradingView)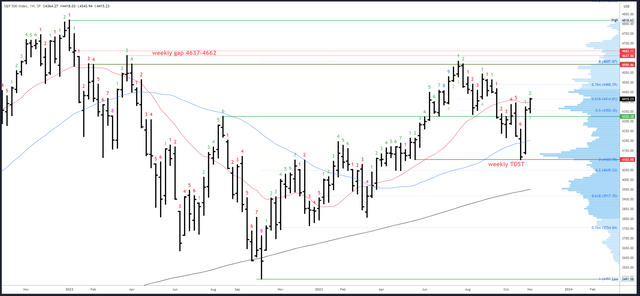
4393 at the 20-week MA and pivot highs could continue to be relevant as a close below would potentially signal a reversal. 4430 is the next minor resistance, then 4541.
The weekly low of 4344 is key support. There isn’t anything compelling below that until the gap at 4117-4132, then the obvious 4103 TDST. However, the 4216 area is worth watching as it marked a previous pivot low in October and the 50-week MA is rising into that area.
An upside Demark exhaustion count will be on bar 3 (of a possible 9) next week.
S&P 500 Daily
Technicals worked very well this week. The 50dma held as support and 4393 resistance initially held for a 50-point drop, but as I said last week, it was a “bit obvious” and broke for a move to the less obvious Wolfe Wave target (the blue diagonal line).
The rally from 4103 now looks about complete at Friday’s 4418 high based on the location of the continuation gap. However, there is not yet any sign of a reversal and the strong close does project further upside early next week. Ideally this is a failed gap higher or a quick spike and fade into a week close. Closing below 4393 should signal the beginning of the reversal and breaking 4334 would confirm a correction is underway.
SPX Daily (TradingView)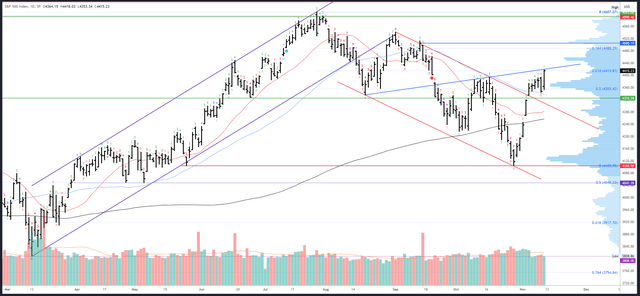
Minor resistance is 4430 and 4460, then a major level at 4505. This latter level is only likely to be reached on the next leg higher after a large correction.
Initial support is the gap at 4334 in confluence with the 50dma. However, this should eventually break as larger dip is needed to correct the rally. The gap at 4237-68 is a more compelling area and is around the 50% retrace.
The upside Demark exhaustion count aborted on bar 8 after Thursday’s dip. A new upside count is underway and will be on bar 2 on Tuesday. A reaction is expected on bars 8 or 9 which means no reaction is expected next week. Indeed, it is likely to abort again and shift into a downside count.
Drivers / Events Next Week
The main event of the week is Tuesday’s CPI release. The month-on-month reading is expected to dip to 0.1% which should take the year-on-year to 3.3%. Core is expected to remain sticky at 0.3% and any upside surprise may be prompt a negative reaction in stocks given Powell’s hawkish comments this week. Even so, it would surely take a massive beat and reading of 0.5% or over to get the Fed serious about hiking again.
Tying this in with the expected moves of the S&P500 (not always a wise thing to do as I rarely call both the move and the catalyst correctly), a beat could provoke the expected dip, but one that is unsustained as the Fed still won’t hike.
Wednesday’s session will bring releases on PPI, Retails Sales and the Empire State Manufacturing Index.
Unemployment Claims are due on Thursday and 222k is expected. This week saw a miss and reading of 217k so there is no need to panic yet about unemployment, but watch for readings near 250k to put recession fears back in focus.
Moody’s lowered its outlook on the US credit rating to “negative” on Friday but left the Aaa rating unchanged for now. This was a short-term positive as there were concerns of an imminent downgrade. However, it could still happen in the coming months and Moody’s is the only rating agency to have maintained the top rating.
Probable Moves Next Week(s)
The prognosis for next week looks quite clear as the S&P500 has reached 4415 resistance with a questionable FOMO rally on low volume. Friday’s buyers are looking for another higher close on Monday to make it 18 out of 19, but one of the reasons Mondays have been higher is because Fridays have generally been weak. i.e. traders have reduced positions on Friday due to weekend risk and then bought back the following Monday. The situation is different this time as traders actually chased the rally on Friday. Perhaps the set-up is becoming too obvious, and in any event, who is left to buy next week?
4393 is key to next week’s action. Whether there is a failed new high above 4418 before any reversal remains to be seen, but given the strong weekly close it still looks probable. 4430 is the next resistance but may not be reached. Any failed rally and close below 4393 should be enough to flush out FOMO buyers and start the next major move.
The next phase should take the form of a large correction which could take several weeks and eventually break 4334-44 support to reach the 4200s. I can’t yet be exact with a destination as targets develop based on price action and structure, but the gap at 4268 is a logical spot near the 50% retrace.
Any top formed next week should only be the end of the first leg of a larger rally. While it could lead to a decent-sized (100-200 point) correctional dip, it should be a buying opportunity for another proportional leg higher, likely around Thanksgiving / Black Friday.
Read the full article here