Thesis
My investment research follows the below quote from Benjamin Graham:
“Bond selection is primarily a negative art. It is a process of exclusion and rejection, rather than search and acceptance.”
However, I use exclusion not only for bonds but for equity, too. In today’s article, I will apply that mental model to TriplePoint Venture Growth (NYSE:TPVG). At first glance, the company had a solid last quarter with growing net investment income, rising assets, and paying generous dividends. Looking at the details, a lot of questions arise. Neither the previous quarter was such a success, nor dividends supported by strong financial results, thus TPVG is undervalued for a reason.
Company Overview
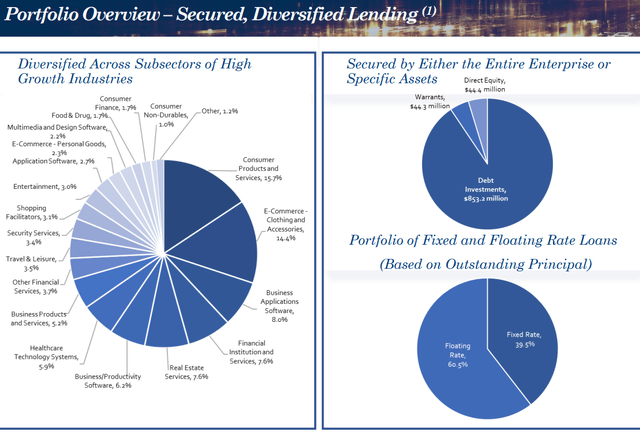
TriplePoint Venture Growth (TPVG) is an externally managed BDC focused on direct equity and loan investments in venture-stage firms in the IT and other growth industries. Software, e-commerce, and consumer services are its three essential allocation areas. The graph below from the last company presentation shows its portfolio structure.
TPVG presentation
The heavyweights are consumer products and services and E-commerce. They constitute 30 % of the portfolio. I mentioned that analyzing PennantPark’s (PNNT) supermarket portfolios is a red flag for me. Apart from those two industries, the rest of the TPVG`s investments are scattered across diverse industries like PNNT.
TPVG prioritizes debt investments, representing more than 85 % of the total. 39.5 % of the debt is issued with a fixed rate and 60.5 % with a floating rate. In an environment with higher for longer interest rates, such a high percentage of fixed-interest debt commitments has twofold consequences. First, TPVG`s cost of funding will grow, and its net investment income will decline. Second, the margin between the cost of funds and interest payment might become insignificant or even harmful. Hence, TPVG liquidity will be adversely affected too.
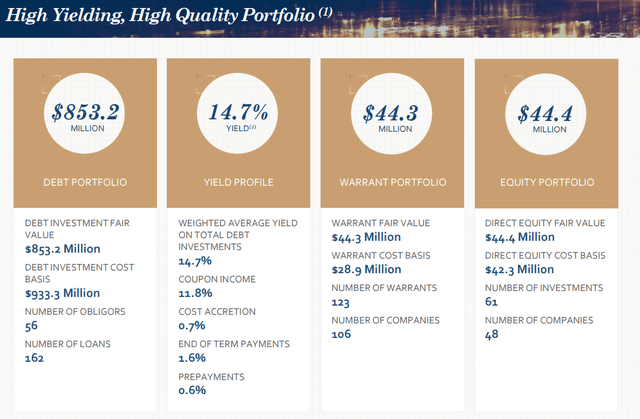
One thing I like about TPVG is the emphasis on debt investments. The table below shows their parameters.
TPVG presentation
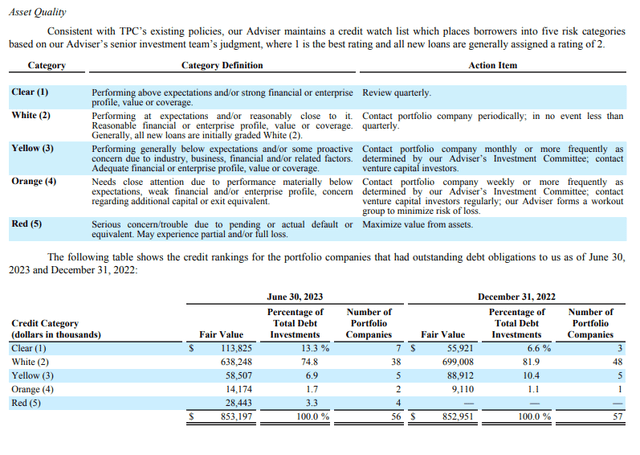
A yield of 14.7 % is a respectable achievement. However, we must consider the context of coupon income, which is 11.8 %. That said, part of the company’s debt investments are priced below their face value. The image below from the last report shows the company’s portfolio structure by borrower quality.
TPVG presentation
The commitments are divided into categories by color. Yellow, orange, and red are exciting, adversely affecting the company’s portfolio. All three together represent 11.7 % of the total. Last quarter, in the red bucket, we had four companies compared to zero in December 2022. The number of companies declined, too, from 57 to 56.
Q2 2023 Results
The last quarters were rough for TPVG. Despite growing interest income, its net realized gains are deeply underwater. As noted above, some of TPVG`s investments must be written off, thus causing unrealized losses affecting the company’s bottom line.
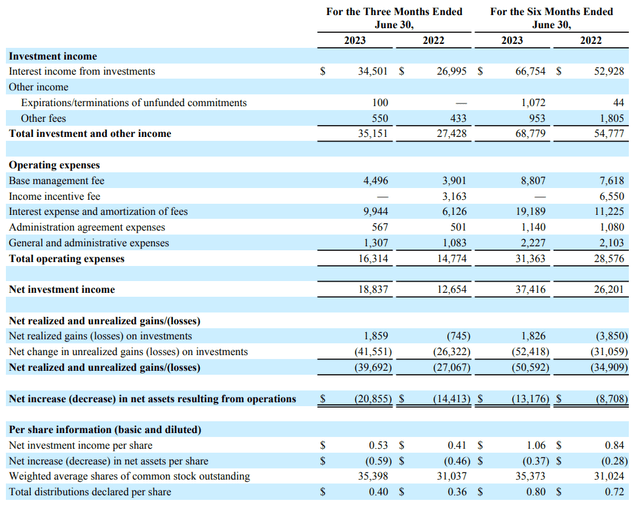
Let’s dig deeper into the company’s last income statement. The image below compares TPVG performance for three and six months in 2022 and 2023.
TPVG Q2 2023 report
Interest income from investments grew along with the company’s expenses but later at a slower rate. Thus, net investment income increased from $ 12.65 million to $ 18.83 million last quarter. The troubles are arising due to growing unrealized gains (losses). As mentioned above, the distressed businesses are too much for my taste in TPVG`s portfolio.
Company Financials
TPVG’s balance sheet quality is adequate, apart from its investments. The company has sufficient liquidity measured with quick and current ratios. The table below shows some metrics I use to estimate the company’s balance sheet health. The data is from the last financial report.
|
Quick ratio |
3.5 |
|
Current ratio |
4.08 |
|
Long-term debt/Equity |
166 % |
|
Total debt/Equity |
166 % |
|
Total liabilities/Total assets |
36 % |
The level of debt is not high compared to its peers, nor the liabilities as a percentage of total assets. That said, let’s look in detail at TPVG`s funding sources.
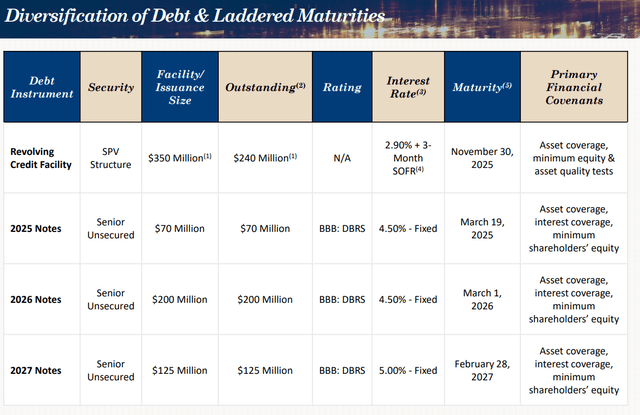
TPVG presentation
As seen in the image above, TPVG issued senior unsecured notes due every year from 2025 till 2027. The good thing is the fixed interest rate provides a cushion against liquidity troubles. At first glance, the size of the debt is not overwhelming, and it does not represent a danger to the company’s solvency. However, TPVG`s poor performance questions its ability to pay its debts without selling assets.
TPVG’s profitability metrics give a mixed impression.
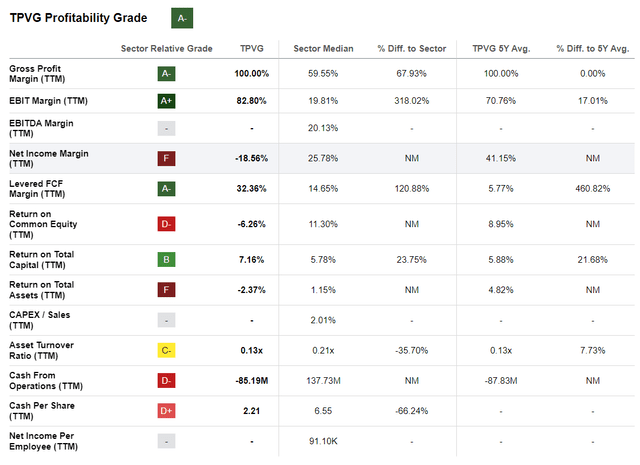
Seeking Alpha
The company’s margins are still good and above TPVG`s five-year average values. Return on Equity has declined considerably in the last 12 months due to unrealized losses.
TPVG has been paying dividends. However, given the company’s results, I hesitate about how sustainable that is. The image below shows TPVG dividend metrics.

Seeking Alpha
Net investment income has been rising in the last quarter. This will cover the dividend payments for a while, but in the long-term, the company’s ability to distribute dividends remains disputable.
Valuation
To calculate TPVG value with the Dividend Discount Model, I have to measure the price of the company’s equity and levered beta.
To obtain those numbers, I use the following steps and assumptions:
- Risk-free rate equals the 5Y average of USA long-term Government bond Rate, 2.2%.
- Growth rate, g, equals the 5Y average of the USA long-term Government bond Rate, 2.2%.
- US’s equity risk premium is 5.00 %.
- TPVG’s unlevered Beta 0.96
- TPVG Debt/Equity ratio 100 %.
- The US’ effective tax rate is 25 %.
- TPVG dividend (TTM) $ 1.59
- Calculate Levered Beta with the formula below:
Levered Beta = Unlevered Beta * (1+D*(1-T)/E).
2. Calculate the discount rate (discount rate as the cost of equity) using the resulting value for leveraged beta. The formula I use is:
Cost of Equity = Risk-Free Rate + (Levered Beta * Equity Risk Premium).
3. Calculate the Terminal Value of dividends considering the Cost of Equity and Expected dividend growth:
Terminal Value = Dividend per share * (1 + expected dividend growth) / (Cost of Equity – Expected Dividend Growth)
4. Calculate the Present Value of Terminal Value assuming a constant discount rate for ten years.
For TPVG, I get the following results:
Intrinsic value per share = $ 21.92
Current Market price = $ 10.7 on Sept 19, 2023
As seen above, TPVG distributes generous dividends; thus, the company is deeply undervalued based on the dividend discount model. At the current market price, it offers more than a 50 % margin of safety.
Risks
Business development companies are banks for the venture capital industry. As such, they carry the same risks: credit, liquidity, operational and market risk. TPVG’s balance sheet is healthy, with sufficient liquidity. On the other hand, TPVG’s liquidity risk depends on its ability to pay its debts. As shown, from 2025 till 2026, TPVG senior unsecured notes will mature yearly. TPVG’s deteriorating performance will challenge its capacity to settle its debts. If the performance downtrend persists, TPVG has to cut dividends and new investments or liquidate assets to meet its obligations.
The economic risk in the face of inflation and interest rates is always present. Higher for longer is positive for lending businesses in general. TPVG’s debt portfolio has almost 40 % debt with a fixed rate. Hence, higher rates in such cases will dwindle net interest margins and the company’s bottom line.
Market risk is related to broad equity market performance. Last year has been successful for equity investors despite regional banks’ turmoil and rising global uncertainty. The tide lifts all boats, as is the case with TPVG. Its share price did not soar parabolically, but given the company’s uncertainties, it ascended by 10% given today’s price.
Conclusion
TPVG is a below-average BDC company with a supermarket balance sheet, a growing percentage of distressed investments, and a too-large portion of its debt portfolio that carries fixed interest. Rising net investment income, generous dividend yield, and 50 % margin of safety are not enough to consider TPVG investable. In conclusion, I give TPVG a sell rating.
Read the full article here


